Infographics are everywhere: easy to recall, simple to comprehend, visually engaging and fun to share.
The upswing in the adoption of infographics in content marketing has some hard-to-resist drives behind it.
- The human brain processes visual information 60 times faster than written information.
- Infographics increase sales by up to 80%.
- 65% of buyers are visual learners.
- Web articles with images receive 94% more views than text-only content.
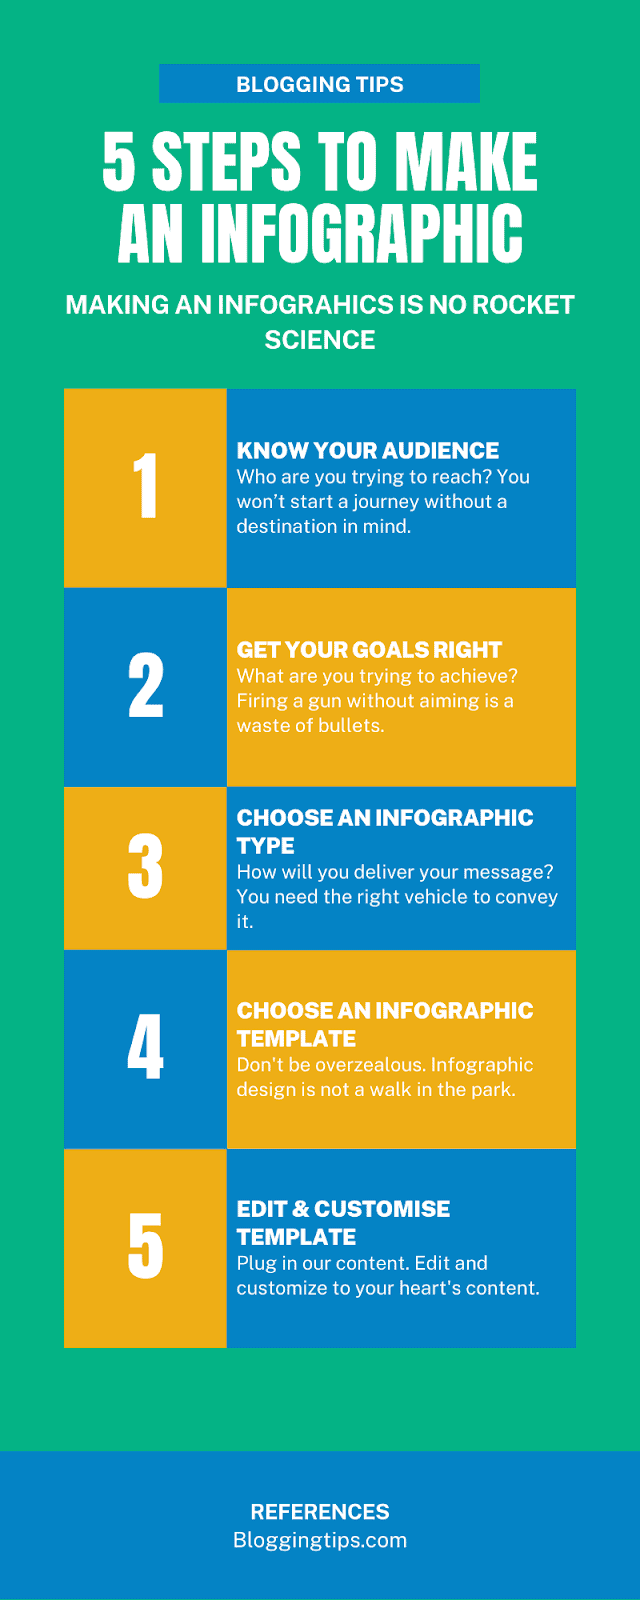
Making an infographic is no rocket science. Whether you are an experienced designer or a total newbie, this guide will teach you how to make an infographic in 7 simple steps.
- Frequently Asked Questions
- What You’ll Need to Make an Infographic
- How to Make an Infographic in 7 Steps
- Step 1: Know Your Audience
- Step 2: Get Your Goals Right
- Step 3: Choose an Infographic Type
- Step 4: Gather Your Content and Data
- Step 5: Create and Organise Your Content
- Step 6: Choose an Infographic Template
- Step 7: Edit and Customise Template with Infographic Best Practices
- Wrapping Up
- More Helpful Tutorials:
Frequently Asked Questions
What is the Format of an Infographic?
If you want to publish an infographic on your website, the best format is PNG or JPG.
If you want to print your infographic, PDF format is the best.
Printing an infographic in PNG or JPG format will reduce its quality, while publishing it in PDF format can be tricky as it can’t be easily embedded.
Can You Create an Infographic for Free?
Of course, you can create an infographic for free.
With the help of free online infographics makers, you can present your information in the most compelling form to your readers.
Some of these tools offer tons of editable and customizable templates to create beautiful infographics in little to no time.
What You’ll Need to Make an Infographic
- An Infographic Maker: Some of the best graphic design software like Canva, Shutterstock, and Adobe Photoshop are good infographics makers. You’ll one to make an infographic.
- Your Content and Data: In infographics, content is as important as design, if not more. Before creating your infographics, you’ll need to collect content and other relevant data. We’ll show you how in the coming sections.
How to Make an Infographic in 7 Steps
- Step 1: Know Your Audience
- Step 2: Get Your Goals Right
- Step 3: Choose an Infographic Type
- Step 4: Gather Your Content and Data
- Step 5: Create and Organise Your Content
- Step 5: Create and Organise Your Content
- Step 7: Edit and Customise Template with Infographic Best Practices
Step 1: Know Your Audience
Who are you trying to reach?
Like all other marketing efforts, the first step in making an infographic is to define your target audience.
You won’t start a journey without a destination in mind. Don’t create an infographic without having an audience in mind.
No matter how fascinating the content, concept and designs are to you, if your audience is not involved, it’s just noise.
You’ll end up with a beautiful design that moves no needle.
The world is not your audience. Infographics should be approached with the goal of simplifying and communicating a message to a specific audience.
When you try to speak to everyone. You end up speaking to no one.
Finding answers to these questions will guide you right.
- Who is my ideal audience?
- What’s their level of knowledge about the topic?
- What do they care about?
- How will my infographic help them?
As you identify your audience, you should also know who they are not.
Knowing who you are creating the infographics for will help you determine the best approach, style and type of infographic you’ll use.
This will also help you deliver your content in a language and tone that resonate with them.
For instance, creating an infographic for your colleague or managers at work can use more technical jargon or lingo.
You won’t get away with the same lingo in an infographic for your customers.
Two infographics on the same topic will differ because their audience is different.
Say you want to make an infographic on personal hygiene.
A fraction of your audience is elementary school kids, while the rest are college students.
In this scenario, an effective infographic for kids will differ from that for undergrads.
The former will use less text and more fun elements like icons, images, and bright colors to arrest kids’ unstable attention.
The latter can use more text, solid colors and moderate images.
That’s why you need to identify your audience.
Step 2: Get Your Goals Right
Identifying your audience is a thing. Having a clear goal is another ballgame entirely.
The idea of making an infographic because it’s a staple in the modern marketers’ diet can appear nice to you. But it’s not.
You don’t create an infographic for the sake of it.
Pushing out content without a goal is like firing a gun without aiming. You may hit a target, but it’s definitely not the target you want.
While trends might be a compelling reason to jump on the bandwagon, swimming along without a goal will be a waste of time and energy.
That, if it doesn’t drown you.
There are several good reasons for creating an infographic. Look at the following;
- Simplify and break down a complex process: When you have a complex process that your audience can’t seem to wrap their head around, you can create an infographic to demystify the process.
- Present a quick overview of a topic: Many businesses use infographics when Introducing a new concept to their team, customers or business associates. This involves outlining project plans, rolling out new operation models or introducing new features or services.
- Showcase research, studies or survey findings: The best way to tell a story with data is through Infographics. A lot of people are innately interested in survey data. Using infographics is the perfect way to share them on social media or your website.
- Summarise a long blog post: You can use an infographic to summarise your content. Presenting crucial points in your long-form post on a single infographic.
- Comparison of two or more items: An infographic is an excellent option when you have two more concepts to compare and contrast. Rather than text, your audience will see it as a visual summary.
And there’s more. Whatever your reason. The goal should be to create an infographic that your audience actually cares about.
With this out of the way, deciding on the type of infographic that is effective for your message becomes easy. Let’s look at the options you’ve got.
Action: For this tutorial, our goal is to summarise this blog post. Keep an eye on the action tag under each section to follow along.
Step 3: Choose an Infographic Type
Once you are clear with the goal of your content, the next step is to choose the type of infographics that works best for the content/data you want to present.
Picking the right type of infographic for presenting your data/content takes you a step closer to creating an effective infographic.
Depending on your goals, the following are some of the most used infographics you should consider.
- Informational Infographics: Informational infographics are the most common on blogs and social media. Partly because they are easy to make. Informational infographics are mostly an aggregation of information blocks with bite-sized content. When not highlighting a new topic, they expound on a concept or list punchy points.
- Statistical Infographics: These infographic types present surveys and research reports. They are common with publishers who deal with a high volume of data and numbers for conveying data-driven stories. They come with charts for data visualisation.
- Timeline Infographics: Timeline infographics present chronological occurrences of events, concepts or stories. It overviews events and highlights important points such as dates and stages.
- Process Infographics: A process infographic presents information in a step-by-step and hierarchical structure. They are usually designed to flow from left to right or top-to-bottom to guide the reader’s eye from the first step to the last.
- Comparison Infographics: A comparison infographic presents content side by side to prove the advantage of one concept over another. They illustrate the differences between different items and are designed in a tabular layout.
As you can see, each infographic type represents information uniquely. Identifying the best type of infographic for your message will guide you when picking a template for your content.
Check this guide to learn about the types and definitions of infographics.
Action: The right type of infographics for our purpose- summarizing a long post is- process infographics. It has the step-by-step and hierarchical elements we need.
Step 4: Gather Your Content and Data
This is where many people get it wrong. The information you gather should support your goal and the type of infographics.
If you have your own data, good. If you don’t, you’ll need to source your information somewhere. So, where do you get this data?
Google– You guessed right. If you know how to dig through this internet engine, you’ll land valuable, relevant info for your purpose.
But there are other online data repositories you can scour for data. Statista, Pew Research, and Kaggle are great data sources for internet entrepreneurs.
As you collect data for your infographics, here are 2 things to keep in mind.
- Choose the right data: Data for the sake of data is of no point. Ask yourself what story you want to tell with your data. The data you collect must give your audience a comprehensive narrative around the context you present.
- Less is more: Truck-loading data in your infographic might sound nice. It’s not. Data overload will only overwhelm your audience. The message you want to pass is more important than the number of data.
- Action: We are using our own content, which are the headings, subheadings and short descriptive body of text from each section in this guide.
Step 5: Create and Organise Your Content
The next step in making an infographic is to create an outline for the content that will go into your design.
You’ll create this outline using the infographic type you choose.
Remember, an infographic is not where you say it all. You have to use the least word possible to make the content less intimidating and easy to grab.
Infographics are widely embraced because of their easy-to-digest structure.
It pays to create your outline in Google docs or Microsoft Word. Writing copy directly into your design can be a pain in the neck.
An outline will help you arrange your content into clusters. Try to keep the word count of each section even.
That way, you’ll have balanced content all through. This will make your design more professional and easy on the eyes.
The structure of infographics differs according to type, but there’s a basic structure common to all.
- The Headline: The main idea of the infographic. Short and crisp is the rule here.
- The Introduction: A short teaser sentence under the headline that encourages viewers to read on.
- Body Content or Copy: It varies from one infographic type to another. It breaks down each point in your infographic into subheadings and sections with supporting elements such as data, icons and charts.
- Conclusion: Not always, but usually used for CTA by marketers. In our case, we might invite viewers to visit our blog to read the full article. You’ll see that soon.
- Footnotes: Sources and references go here at the bottom of your infographic.
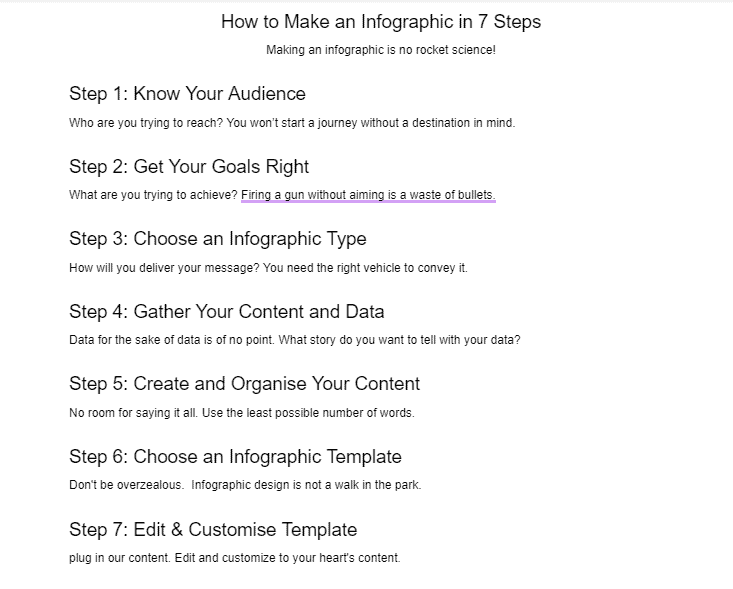
Following this basic structure, our infographics outline written in Google docs or words will look something like this.
Actions: Our content outline on Google Docs will look something like this;
Step 6: Choose an Infographic Template
Now that your data is ready, your goal is set, and you know the type of infographics that’s best for your message, It’s time to create your infographics.
Let’s face it. Infographic design is not a walk in the park.
Unless you are a designer, don’t be overzealous and think you can design an infographic from scratch. You’ll end up with a disaster.
Picking a template will do more than fast-track your job. You can create professional-like designs in minutes.
You only have to adjust and customize templates to your needs.
The process is straightforward. Go to any online infographics makers and choose a template with the closest characteristics to the type of infographics you choose in step 2.
Edit, customize, and play around until you arrive at something decent.
You won’t get everything right in the first go. With practice comes mastery.
Action: Now, we’ll visit an online infographics maker and look for a template.
We’ll be using Canva here. But remember, there are Canva alternatives with a forest of templates you can check out.
Log in to Canva. You can quickly create a Canva account if you don’t have one.
Once you are in, type process infographics in the search box.
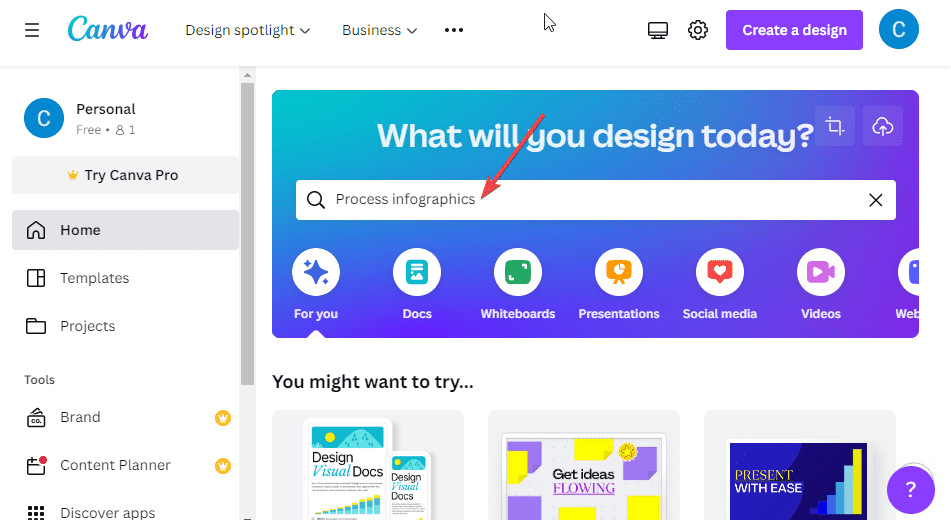
Canva will show you hundreds of premade process infographics templates.
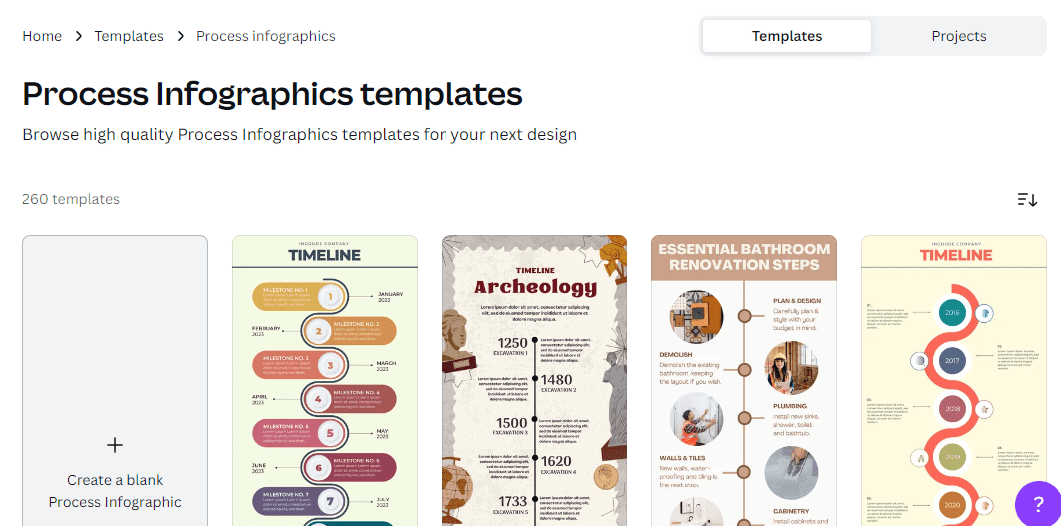
All the infographics template on this page has steps and hierarchy to perfectly present our content. Here’s what we settle for;
Now that you have a template. What next?
Step 7: Edit and Customise Template with Infographic Best Practices
The last step in making an infographic is to move things around.
This is where you add your infographic copy, change colors, and adjust fonts. Etc.
The first thing we’ll do on this template is plug in our content. We’ll copy and paste the content of the outline we created above.
Not perfect, but the result will look something like this;
As you edit your template, here are some infographics best practices to guide you.
- Font: Use one font for the headline and one for the body throughout. Make the font size even.
- Colour: Avoid color overkill. Besides neutral colors, black, white and grey, one primary color and, at most, three secondary colors are okay.
- Icons: Make sure the dimension of your icon is uniform.
- Whitespace: Use an abundance of whitespaces around texts and other elements in your design.
- Segment sections: Divide your infographic into clearly-defined sections with alternating colors, icons, lines, and subtitles.
- Alignment: Ensure all elements align on the same horizontal and vertical axis. Make sure the spacing is uniform. Most infographics makers have rulers to help you.
Wrapping Up
If you’ve dreaded making your own infographic, now you know is not as overwhelming as it appears. You can make an infographic without any design experience.
You only need one of the top-rated infographics makers and this 7-step guide. And you are set to add infographics to your content strategy.
Welcome to the world of visual marketing. Have questions or suggestions? Reach out in the comment section below.
More Helpful Tutorials:
- How to Make a Gif: Learn how to create your own GIFs using image editing software like Adobe Photoshop or online tools like Canva.
- How to Resize an Image Without Losing Quality: Learn how to resize an image without losing quality with some of the best tools online and offline. This is a practical guide.
- How To Write A Blog Post: Discover the secrets to a successful blog post. This guide will help you create thoughtful and informative content for your audience, from ideation to research and creation.