
Pingdom is one of the household tools for WordPress performance optimization.
Whether you are a decade-apt WordPresser or just stepping in, You should try the Pingdom speed test. Why?
Speed tops the list of all core web vitals that Google uses to evaluate website usability.
A slow-loading site does more than frustrate your visitors.
As it sends a go-elsewhere signal to potential customers, it gives search engines a compelling reason to de-rank your site on SERPs.
Optimizing your website loading speed is the way out.
And that’s Pingdom speed test comes to play.
In this article, we’ll go through how to run a Pingdom speed test to detect what’s causing your website’s sluggish response to clicks and queries. And you can cut load time significantly.
Frequently Asked Questions
What is a Pingdom Speed Test?
Pingdom Speed Test is a free tool for monitoring website speed and page performance.
The tool checks all the elements on your website, from images to stylesheet and external codes, and shows you how long each takes to load.
Pingdom also shows you an overall performance grade and load time of your pages based on size, with recommendations on what you need to improve.
How Does Pingdom Work?
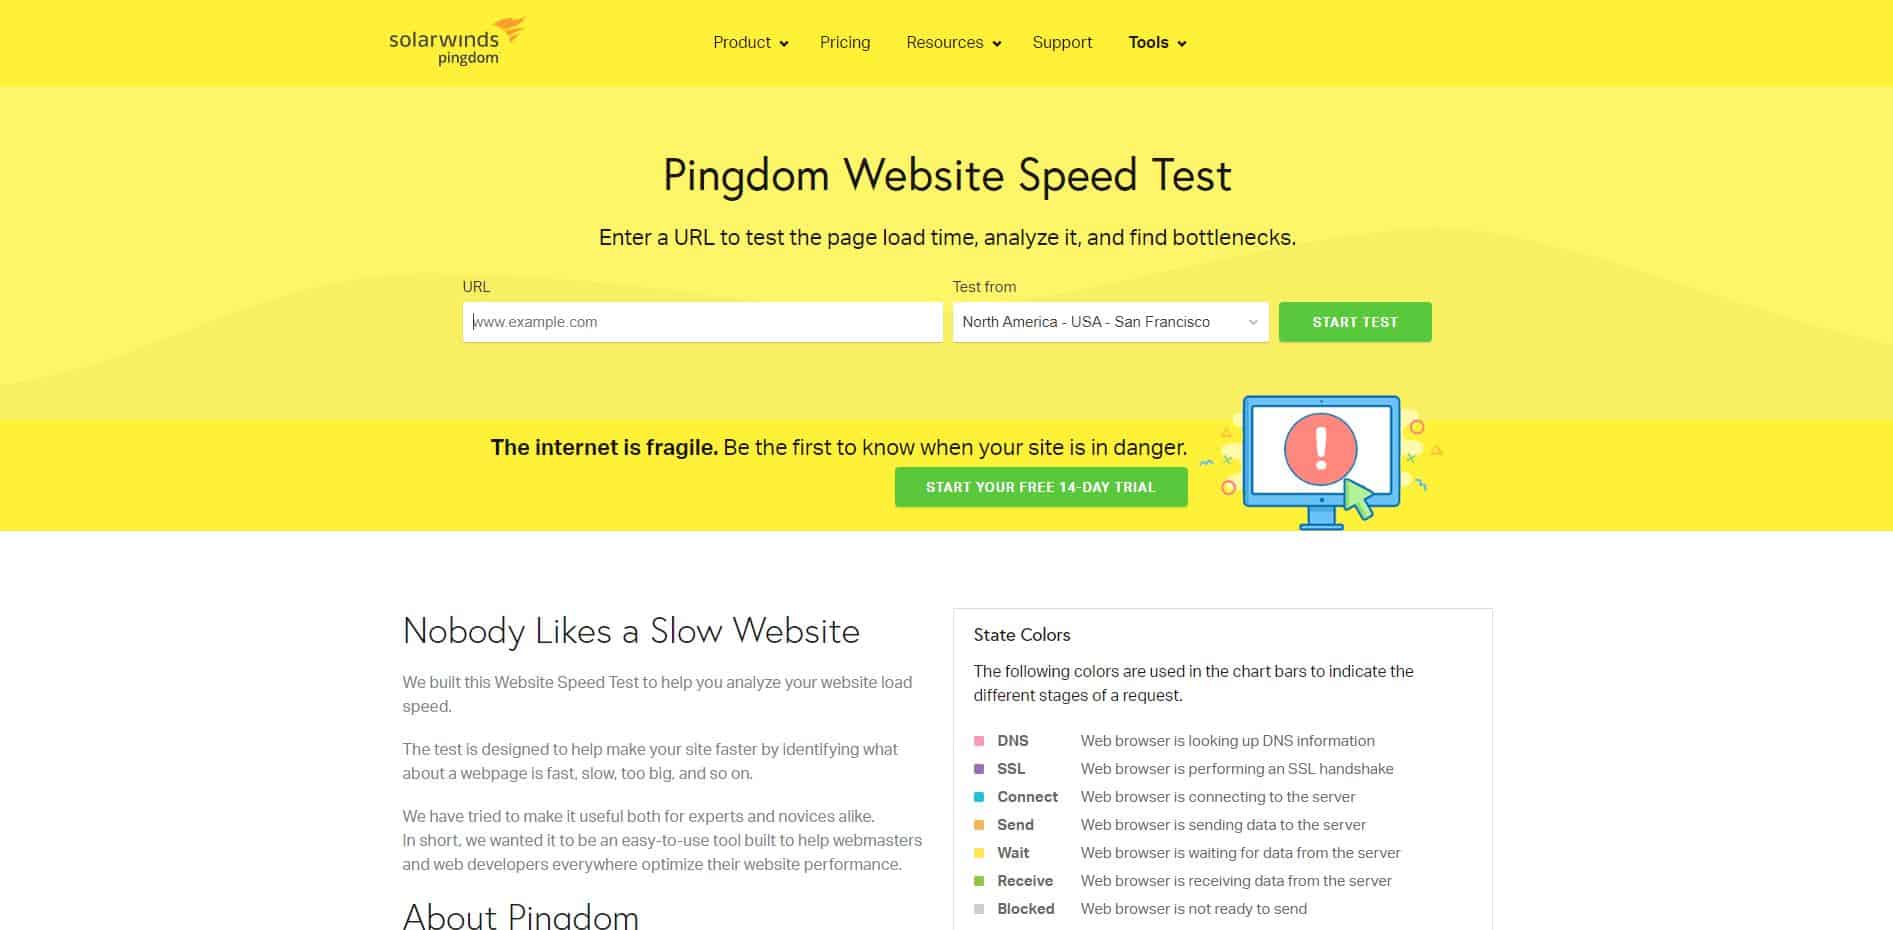
The Pingdom speed test is simple to use.
Plug in your page’s URL, choose a test location, hit the Start Test button, and wait for Pingdom to do its magic.
The result shows your website speed with a breakdown of the impact of each element. Pingdom recommends how to reduce load time.
How to use the Pingdom Speed Test Step by Step
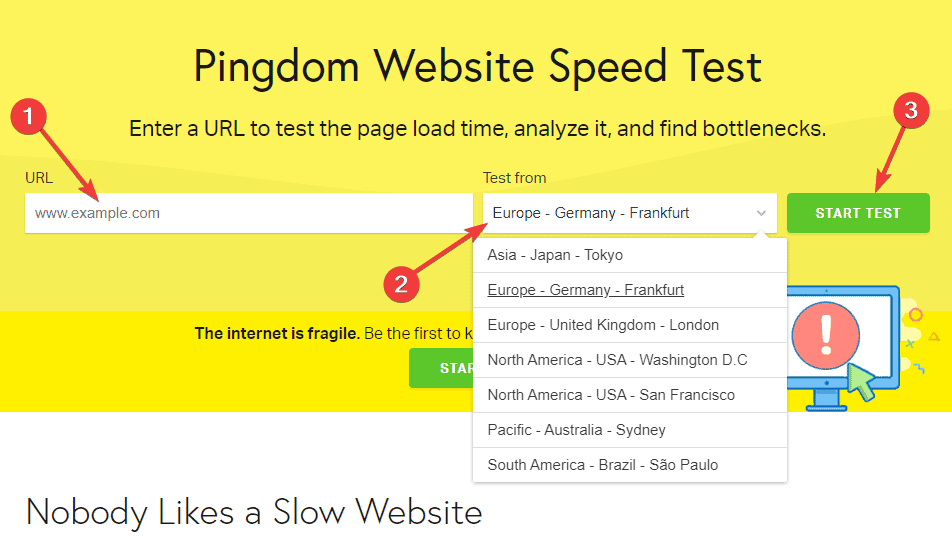
Step #1: : Input your page URL
Pingdom Website speed test is not a full-fledged SEO audit tool. You can’t run a sitewide test on it.
The tool can only analyze one website page at a time. Thus, if you have multiple pages to test, you’ll have to do it one at a time.
Step #2: Select Your Test Location
After inputting your URL, choose a location to run your website speed test.
Currently, Pingdom supports testing from 7 different locations;
- Asia – Japan – Tokyo
- Europe – Germany – Frankfurt
- Europe – The United Kingdom – London
- North America – USA – Washington D.C.
- North America – USA – San Francisco
- Pacific – Australia – Sydney
- South America – Brazil – São Paulo
The location you choose is important as it will affect the network latency and your website connection quality.
The best location for your test depends on where your visitors are coming from.
If your visitors are not in any of Pingdom’s listed locations, select the location tags closest to your visitors.
Step #2: Check the result
Once you click the START TEST button, Pingdom will take a few seconds to return your page result.
There are 7 sections on the Pingdom test result page.
Each shows a performance grade and recommendations for improvement. Let’s make sense of each section on the Pingdom test result page.
Understanding Pingdom Speed Test Result
The 7 sections on the Pingdom speed test result page are as follows;
- Pingdom Summary
- Improve Page Performance
- Response Codes
- Content size and requests by content type
- Content size and requests by domain
- Waterfall Chart
Pingdom Summary:
At the top of the result is Pingdom Summary, the first section you’ll see. As in the screenshot below.
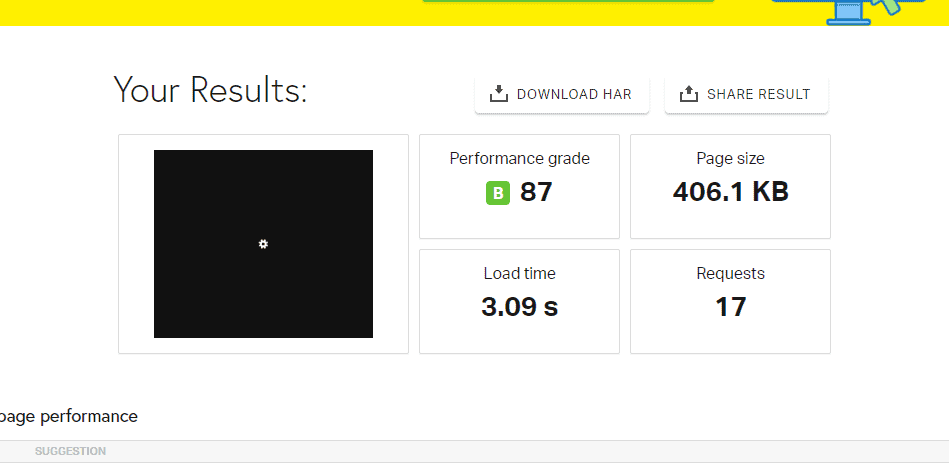
In this section, Pingdom presents the overall page report with numbers depicting your website performance grade, page size, load time, and Requests.
So what does each of these mean?
- Performance Grade: This indicates your site’s overall speed and performance, graded from A -D.
- Page Size: The size of the page you test, measured in Megabyte.
- Load Time: The amount of time it takes to download all the content on your page, images, videos, stylesheets, Javascript, etc.
- Requests: The number of HTTP requests your page generates.
A web page usually consists of HTML, CSS, Javascript, and media files.
Each makes an HTTP request for them to load on your site. More HTTP requests mean more loading time.
You can improve your performance grade by reducing the number of HTTP requests your page makes. It may not be possible to score a 100%. Just do your best to improve.
Improve Page Performance
In the Improve Page Performance sections, Pingdom will recommend several things you can do to improve your website load speed.
This section might look a bit different depending on what’s wrong with your page.
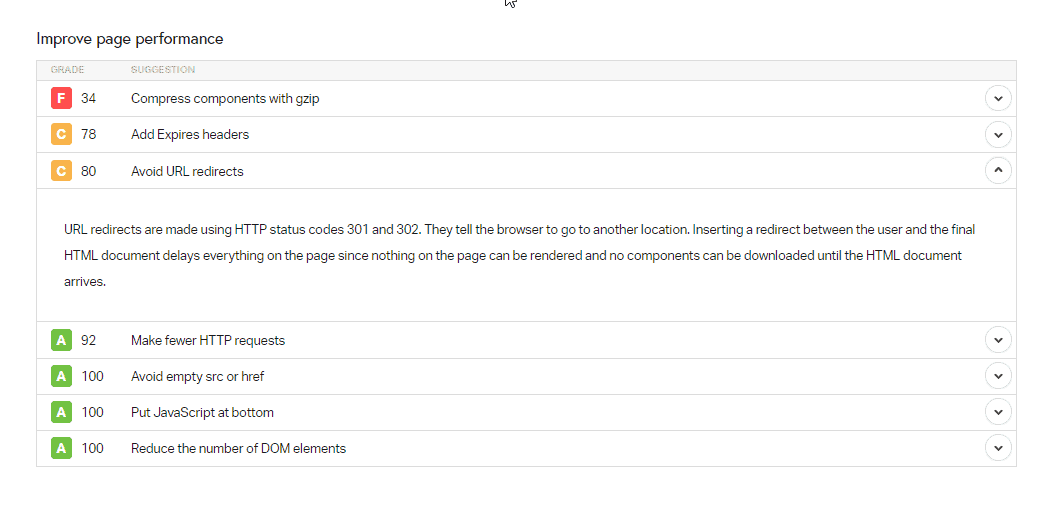
We’ll explain the recommendations that have the most effect on your web page.
For others, click to expand each recommendation tab. They are straightforward on what you need to do.
5 Critical Recommendations from Pingdom Speed Test
- Use a Content Delivery Network
- Avoid URL Redirects
- Compress component with Gzip
- Put Javascript at the bottom.
- Avoid empty src or href
Use a Content Delivery Network
Content Delivery Networks (CDNs) are distributed groups of servers in different parts of the world positioned to deliver copies of webpages to visitors fast.
This network of servers makes content delivery faster by serving a user from the nearest server to their location.
Using a CDN can improve your website speed as visitors are served from proximity. Cloudflare CDN and KEYCDN are two great options if you need a CDN.
Avoid URL Redirects
One of the most common suggestions on Pingdom is too many redirects, which is normal because every site occasionally uses redirects.
Simple redirects like 301 and HTTP to HTTPS are harmless. But when you have too many on your site, they’ll impact your site speed negatively.
Compress component with Gzip
Gzip is a file compression tool that lets you shrink the size of all the elements on your web page at the server level. From HTML files, web fonts, scripts, and style sheets.
When you connect Gzip compression with your site, web browsers receive a compressed page from your server leading to fast loading.
You can enable Gzip compression from your hosting platform. All major web hosting providers offer Gzip compression as part of their hosting packages.
If you can’t find it in your web host account, here are recommended plugins for the GZIP Compression:
- GZIP with WP Rocket
- GZIP with WP Super Cache
- GZIP with W3 Total Cache
Avoid Empty src and href
An empty src and href are encountered when a web browser can only find the HTML attribute without the actual resources.
These empty src and href attributes prompt the browser to make unnecessary HTML requests which amount to wasting server resources.
It’s unlikely to happen on WordPress, except if you add custom codes. If your score isn’t 100% here, you need to check your website source code and look for empty media and links attributes. Once you find them, you can delete them or add the right resources.
Put Javascript at the Bottom
When Javascript is placed at the top of your page, the load first causes the browser to wait before downloading the page content.
Javascript prevents parallel downloads. So other page content will not load until after the Script.
This causes your browser and user to wait.
To avoid it, other content on your page must come before javascript.
That way, search crawlers, web browsers, and even a user with a slow internet connection will quickly see the content they came for.
Responses Codes
The third section in the Pingdom speed test is the Response codes.
These are also called HTTP status codes, which indicate the status of all the elements on the page you are testing.
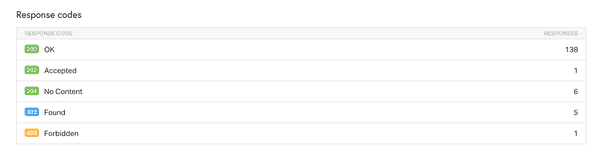
Generally, status codes in the 200s and 300s range depict nothing wrong.
Responses in the 500s and 400s are error codes that indicate you need to fix something, as you can see in the result of your test.
Content and Request Breakdown
There are four tables in this section, each with information about the content on your page, their sizes, types, and the number of HTTP requests they make.
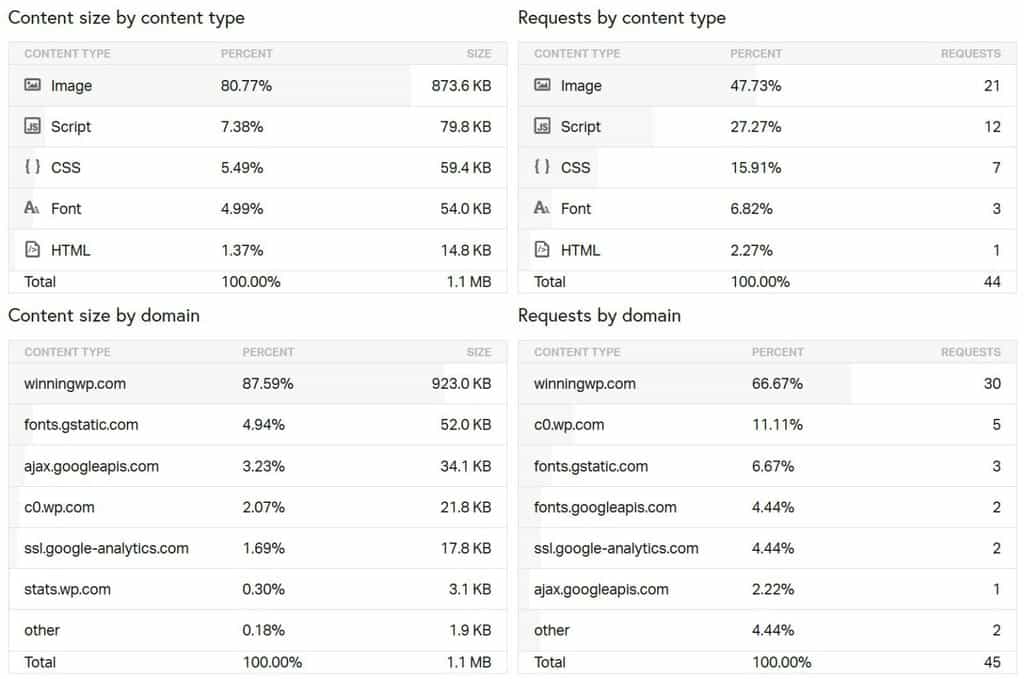
With the information in this table, you can see which element on your website consumes the most resources and use the information to decide on what process you can eliminate to speed up the page. Let’s have a brief look at what each stands for
- Content size by content type: This is a list of all the elements on your page grouped by categories and the percentage of their size. You can use this information to pinpoint which asset on your page is using more resources and which is using less.
- Request by content type: Your web browser makes an HTTP request to load each element on your page. This table shows the number of requests your browser makes per content type.
- Content size by domain: The content size by domain table shows the amount of external content you load on your site. The sources of all external scripts, images, codes, etc., on your page.
- Request by domain: This table shows the number of requests your page makes to load content from third-party servers.
The fewer external content and requests your website have, the better. Having too many external services on your sites means external requests.
Instead of linking to external elements on your site, downloading to your local server will load your site faster.
Also, too many external requests mean more DNS lookup and network latency.
Pingdom Waterfall Chart
Finally, there’s the Pingdom file request section, also called the waterfall analysis, which allows you to look closely at individual HTTP requests on your webpage.
The result is presented in a color-coded waterfall chart format with the color indicating different stages of a request.
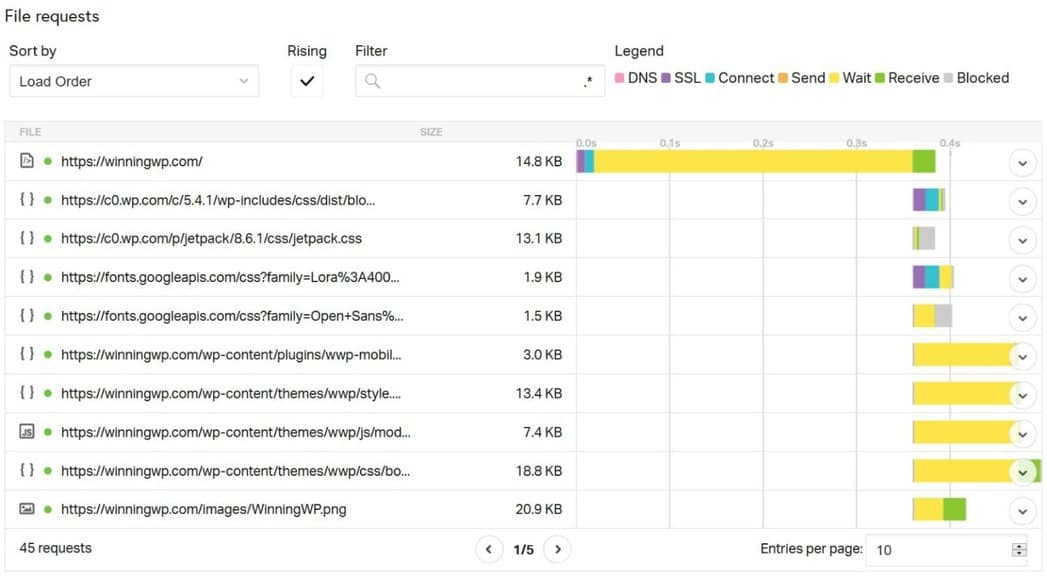
For instance, if you have 26 HTTP requests in the Pingdom summary above, you can analyze all these requests one by one to find out which makes the most.
Developers often use this section to visually understand what’s causing the loading delay and performance bottleneck on your website.
More Helpful Tutorials:
- How to Speed Up WordPress: Is your WordPress website taking forever to load? This tutorial has the answer to speeding up any WordPress website.
- How to Increase Page Speed: Learn simple tweaks and tips you can use to reduce web page load time.
- How to Use WordPress: Want to start a WordPress site but need to know how and where to start? This is the beginner-friendliest WordPress guide on the internet.
Wrapping Up
As you can see, using the Pingdom Website speed test tool is easy.
As your business grows and your website adds more pages, content, features, plugins, advertising codes, etc., monitoring website speed is one of the SEO best practices you shouldn’t abandon.
Pingdom Website Speed Test will be a handy tool to track the performance of your pages.
Do you know other magics that Pingdom can do? Share it with us in the comment section below.